Knowledge Graph
The wiki can be visualized as an interactive knowledge graph. Running build graph extracts all [[wikilinks]], detects communities via Louvain, and produces a structural report (orphans, phantom hubs, god nodes, fragile bridges). Then print graph renders the data into a self-contained graph/graph.html you can open in any browser.
Building the graph
Tell the agent build graph or run the script directly:
build graph                                   # extract + analyze via the agent
print graph                                   # render interactive visualization
python tools/build_graph.py                   # standalone
python tools/build_graph.py --report --save   # with health report saved to wiki
python tools/build_graph.py --tag project-x   # single project subgraph
The build graph command scans every Markdown file in wiki/, extracts [[wikilinks]] from the content, detects communities via Louvain, and generates graph data with a structural analysis report. Then print graph renders the interactive visualization at graph/graph.html.
CLI flags
| Flag | What it does |
|---|---|
| --report | Print a full health report to the console |
| --save | Write the report as a wiki page (graph/report.md) |
| --json | Output the report as machine-readable JSON |
| --tag project-x | Build the graph for a single project (comma-separated for multiple) |
Tag filtering
With --tag you can build a subgraph for a single project or a subset of projects. Pages are matched by their YAML frontmatter tags. Comma-separate multiple tags to include several projects in one graph:
python tools/build_graph.py --tag project-alpha
python tools/build_graph.py --tag project-alpha,project-beta --report
This is useful for comparing the density and health of different knowledge domains, or for generating project-specific reports to share with stakeholders.
Graph analysis
When you pass --report, the script runs a full structural analysis and produces a health summary with actionable findings:
Metrics
| Metric | What it detects |
|---|---|
| Orphan nodes | Pages with zero connections — isolated knowledge that should be linked or removed |
| God nodes | Pages with degree > mean + 2×stdev — overly central hubs that may need splitting |
| Fragile bridges | Edges whose removal would disconnect parts of the graph — single points of failure |
| Phantom hubs | Nodes with high betweenness centrality but low degree — hidden structural bottlenecks |
| Communities | Clusters detected via Louvain algorithm — thematic groupings of related pages |
| Density | Ratio of actual edges to possible edges — measures overall interconnectedness |
The report ends with a suggested actionssection — concrete steps the agent can take to improve graph health (e.g. “link orphan page X to entity Y”, “split god node Z”).
Health thresholds
Overall graph health is determined by the ratio of edges to nodes:
Healthy
≥ 2.0 edges/node
Warning
≥ 1.0 edges/node
Critical
< 1.0 edges/node
A healthy wiki should have at least 2 edges per node on average. Below 1.0, many pages are isolated or barely connected — a sign that wikilinks are being missed during ingest.
Machine-readable output
Pass --json to get the full report as structured JSON — useful for CI pipelines, dashboards, or scripted health monitoring:
python tools/build_graph.py --jsonThe JSON includes the same data as the text report: health level, all metrics, per-community breakdown, orphan/god/bridge/phantom lists, and suggested actions.
Interactive visualization
The graph renders as a self-contained HTML file at graph/graph.html — open it in any browser, no server needed. Built with vis.js and a JanusLM-branded interface:
graph.html UI
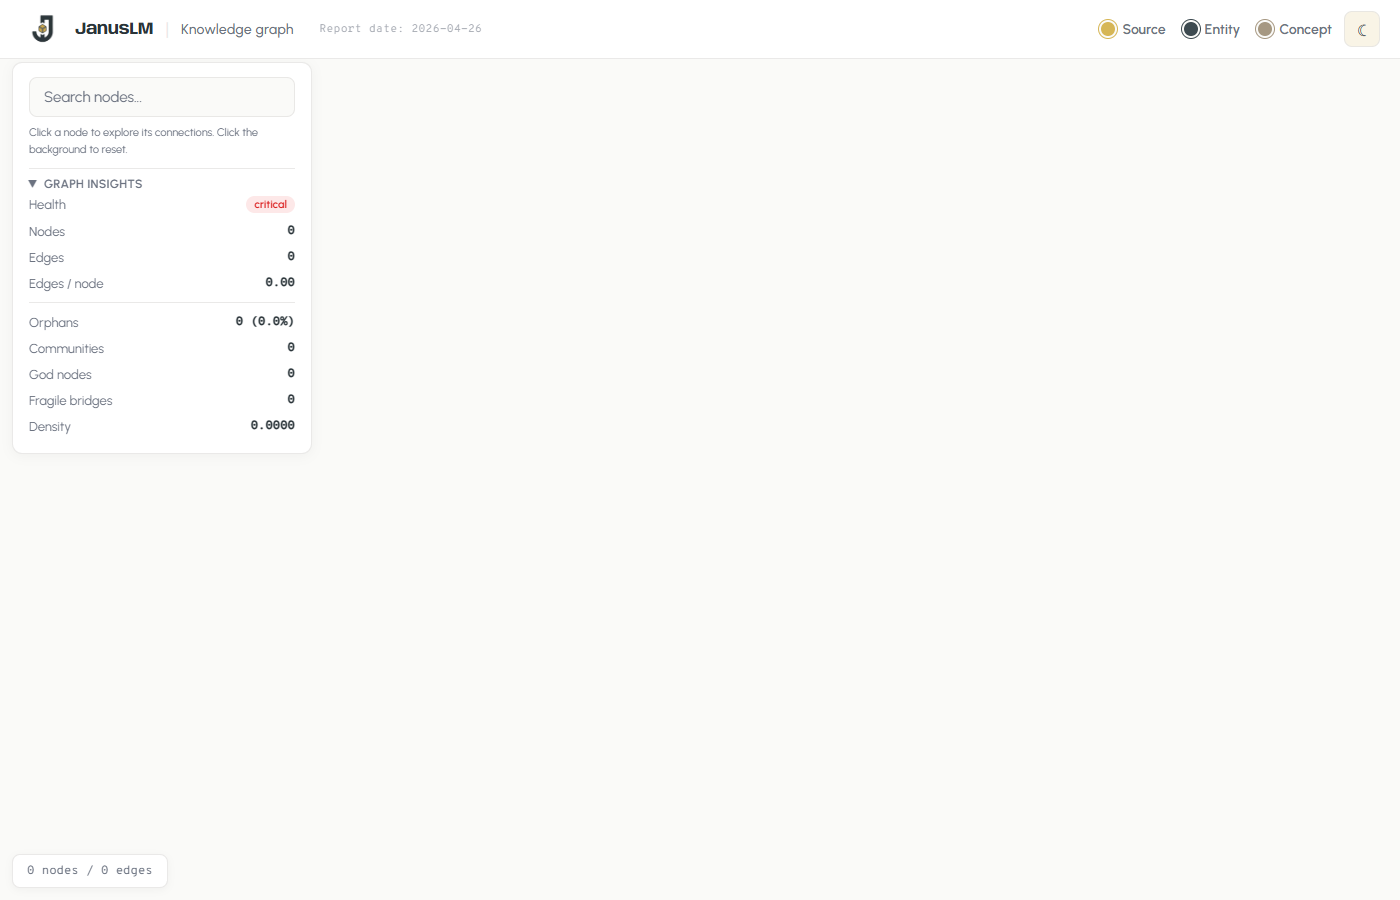
The interface includes a branded header with the report date, a type legend (Source, Entity, Concept), and a theme toggle. The left panel combines search with the graph insights dashboard. The entire UI is fully customizable — since the HTML is generated by a Python script, you can ask any LLM coding agent to restyle it, change the branding, add features, or adapt the layout to your needs.
UI features
Interactive elements
| Feature | Description |
|---|---|
| Search | Real-time node filtering — type to highlight matching nodes and fade the rest |
| Node drawer | Click any node to open a detail panel with type, community, file path, content preview, and related nodes as clickable chips |
| Graph Insights | Collapsible stats panel showing health badge, node/edge counts, orphans, communities, god nodes, fragile bridges, density |
| Type legend | Color-coded circles for Source (gold), Entity (dark), Concept (light) — click to filter by type |
| Light/dark theme | Toggle between light and dark mode — persists across sessions |
| Status bar | Bottom bar showing live node/edge count |
Node types
Every wiki page becomes a node, colored by its type:
Source
Original ingested documents — the raw material of the wiki
Entity
People, companies, products, tools — concrete things extracted from sources
Concept
Ideas, frameworks, methods — abstract knowledge synthesized across sources
Node size scales with degree (number of connections). Community membership is shown in the node drawer when you click a node.
Node detail drawer
Clicking any node opens a slide-in drawer on the right side showing:
- Title — the page name
- Type and community — color-coded badge and community ID
- File path — where the page lives on disk
- Content preview — the first portion of the Markdown content, rendered with wikilink highlighting
- Related nodes — clickable chips that navigate the graph to connected pages
Click the background to close the drawer and reset the graph view.
Layout engine
The visualization uses the Barnes-Hut physics simulation with parameters that adapt based on node count. Smaller graphs get stronger repulsion and tighter springs for a compact layout; larger graphs relax the physics to keep the visualization readable. The simulation stabilizes automatically, then disables physics to reduce CPU usage.
try it
“Build the graph and tell me what's most connected”
The HTML file is fully self-contained — vis.js is loaded from CDN but all graph data is embedded inline. You can share the file directly, host it on a static server, or open it offline after the first load.